Support and resistance are areas, not magic prices
Support and resistance are simple ways to describe where buying or selling pressure has repeatedly become noticeable on a chart. Support is an area where declines have previously slowed or reversed. Resistance is an area where advances have previously stalled or reversed. They are observations about past price behaviour—not guarantees about the next move.
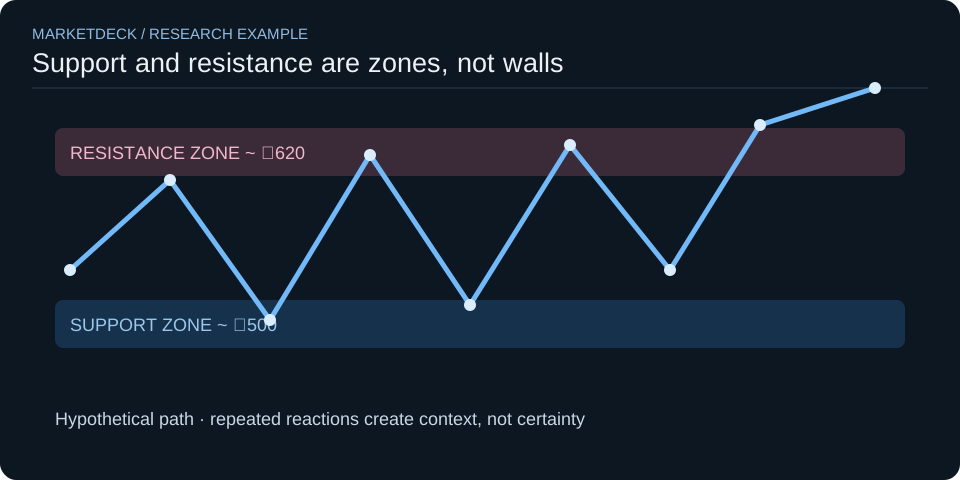
For a beginner, the most useful shift is to stop thinking of support as one exact rupee value. If a stock turned near ₹500 several times, the useful research object may be a zone around that level rather than a line at exactly ₹500. Real markets trade through levels, gap across them, and react differently as new information arrives.
A line on a chart is a hypothesis about where behaviour changed before. It is not a wall the market must obey.
Start with the timeframe before drawing a level
A level visible on a five-minute chart can be irrelevant to someone studying a six-month move. Before marking anything, write down the chart timeframe and the purpose of the analysis. Are you trying to understand a long-term trend, a swing over several weeks, or intraday structure?
MarketDeck’s guide on how to read stock charts explains why timeframe, scale and adjustments should be recorded before interpreting shape. TradingView’s documentation likewise distinguishes chart settings and price-scale behaviour; the exact interface is provider-specific, but the general lesson is that chart settings change what you see. [S1]
For a beginner exercise, use a daily chart covering six to twelve months. That reduces the temptation to mark every small intraday turn. Then look for areas that were tested more than once or produced a visible change in direction.
How to identify a support area step by step
First, scan from left to right and find a meaningful decline that stopped. Mark the area where price stabilized or reversed. Next, continue forward and see whether later declines reacted near the same region. A second or third reaction makes the level more interesting because multiple groups of market participants encountered similar prices at different times.
Do not stretch the evidence. If one low was ₹498 and another ₹507, drawing an exact line at ₹500 can create false precision. A zone such as ₹495–₹510 may better represent the observed cluster in a hypothetical example.
Charles Schwab’s educational material describes support and resistance as price areas where supply and demand have historically affected price movement. [S2] Zerodha Varsity also treats support and resistance as core technical-analysis concepts and places them inside a broader learning sequence with chart types, candlesticks, indicators and moving averages. [S3]
How resistance works in the same framework
Resistance is the mirror image: an area where advances repeatedly struggled. Suppose a hypothetical stock rallies toward ₹800 three times. The first time it falls back to ₹740, the second time to ₹760, and the third time it trades through ₹800 and closes near ₹825.
Calling ₹800 “resistance” before the breakout was a description of history. Once price moves decisively through that area, the old observation needs to be updated. Technical analysis is not useful if the analyst refuses to change the map after the market changes.
Why traders watch repeated tests
A repeated test matters because it shows that the same broad price area attracted meaningful trading more than once. That can make the area useful for planning what evidence to watch next. But repeated tests do not create a mathematical probability that the next test will hold.
Some traders also watch whether a former resistance area acts as support after a breakout, or former support acts as resistance after a breakdown. This “role reversal” is common chart language, but it remains a hypothesis to observe, not a rule.
For a clean beginner workflow, write two statements separately:
- Observation: “Price reacted near ₹800 on three prior occasions.”
- Interpretation: “₹800 may remain an important area if price returns.”
Keeping those sentences separate reduces the chance that a chart annotation turns into certainty.
Use volume as context, not as a stamp of approval
A breakout accompanied by unusually high trading volume may suggest broader participation than a breakout on quiet trading. But volume itself does not prove the move will continue. A high-volume move can also occur near exhaustion, news, index rebalancing or other events.
If your chart provides volume, compare it with the stock’s own recent history rather than using one universal threshold. Then ask what happened after the breakout: did price hold above the old area, immediately reverse, or spend several sessions moving sideways?
Do not confuse trading volume with delivery percentage or other market-specific measures. Those answer different questions and should be defined separately before comparison.
Breakouts need a definition before you test them
“Price broke resistance” can mean many things: an intraday trade above the level, a close above it, a percentage buffer, or several closes. If you change the definition after seeing the result, you introduce hindsight.
Choose a rule first. For example, in a hypothetical study: resistance zone ₹795–₹805; breakout observation requires a daily close above ₹805. This does not make the rule profitable. It simply makes the observation reproducible.
A false breakout occurs when price moves through an observed level and then reverses back. Rather than treating that as proof that technical analysis failed, record it as part of the evidence. The point of a level is to organize what happened, not guarantee what should happen.
The level can weaken when the business changes
Charts summarize transactions, not causes. Earnings surprises, regulatory news, capital raises, corporate actions and broader market moves can make old levels less relevant. NSE’s corporate-action and announcement resources can help identify events that may change the context around a chart. [S4]
That is also why MarketDeck keeps technical analysis connected to other research lenses. Use MarketDeck Charts to inspect price structure, but use company filings and announcements when the question involves business fundamentals. The chart can tell you where price changed; it cannot by itself tell you why.
Common beginner mistakes
The first mistake is drawing too many lines. If every minor high and low becomes a level, the chart stops helping. Start with only the most visible repeated areas.
The second is treating a zone as exact. Markets rarely respect a single decimal point. Use a reasonable area that reflects the observed reactions.
The third is ignoring timeframe. A monthly level and a five-minute level are not interchangeable.
The fourth is moving the line whenever price violates it. That converts an analysis rule into hindsight. Save the original level, then record what happened.
The fifth is assuming support means “buy” or resistance means “sell.” A level is context, not a personalized trading instruction. Risk, time horizon and the reason for the move still matter.
What happens when a level is broken
When price moves through a support or resistance area, do not immediately delete the old level. Keep it on the chart and label the date of the break. The old zone can still help you understand how market behaviour changed. Sometimes price returns to that area later; sometimes it never does. Either outcome is evidence.
Suppose a hypothetical stock repeatedly found support around ₹600, then closed at ₹575 after a weak earnings announcement. The useful note is not “support failed, therefore the chart was wrong.” A better note is: “The earlier ₹590–₹610 support area stopped containing declines after new information entered the market.” That preserves the history and connects the chart to the event.
This is also why backtesting hand-drawn levels is difficult. If the analyst can redraw zones after every outcome, the historical record becomes impossible to audit. Save screenshots or written rules when you want to learn from a process over time.
Support and resistance should not replace risk management
A trader can identify a visually clear support area and still lose money. Price can gap below it before a stop order executes, liquidity can change, and a level that worked repeatedly can fail on the next test. Technical context should therefore be separated from position sizing and loss control.
For an investor, support and resistance may simply help explain where market participants reacted; it does not need to become a trading trigger. For a trader, any trigger should have an explicit invalidation rule and an understood loss if the idea is wrong. The chart helps define the question. Risk management determines whether being wrong is survivable.
A simple chart-reading workflow
- Choose the instrument and timeframe.
- Confirm the chart is adjusted appropriately for the question.
- Mark one or two obvious support/resistance zones.
- Note how many times each area was tested.
- Check volume and major corporate events around important moves.
- Write what would invalidate the current interpretation.
- Revisit the chart without redrawing history.
Open MarketDeck Charts to inspect available chart history and then return to the Technical Analysis learning hub for the next concepts in the sequence.
Frequently asked questions
How many touches make support or resistance valid?
There is no universal number. More than one reaction can make an area more informative, but there is no guaranteed threshold that turns it into a reliable predictor. Focus on clarity, timeframe and whether the level helps organize evidence.
Should support and resistance be a line or a zone?
A zone is often more realistic because different sessions can turn at slightly different prices. Exact lines are convenient annotations, but they can imply more precision than the market actually showed.
Does a breakout mean the stock will keep rising?
No. A breakout only describes price moving beyond a prior area under the definition you chose. It can continue, fail or reverse. Treat it as new evidence to evaluate, not a guaranteed signal.
THE EVIDENCE DESK
Sources and scope
Primary documents, provider documentation and research papers are linked below. The examples are synthetic or explicitly identified; no live return, investment outcome or independent research replication is claimed.
- S1 TradingView: PriceScaleMode ↗
Provider documentation on chart price-scale modes; interface-specific. Reviewed 2026-09-23.
- S2 Charles Schwab: Use Support and Resistance to Read Stock Charts ↗
Educational description of support and resistance; not evidence that a level will hold. Reviewed 2026-09-23.
- S3 Zerodha Varsity: Technical Analysis ↗
India-focused educational sequencing for charts, support/resistance and indicators. Reviewed 2026-09-23.
- S4 NSE: Corporate Actions ↗
Official corporate-action discovery for events that can alter chart context. Reviewed 2026-09-23.
This is AI-assisted educational writing published by MarketDeck. Sources were checked and worked-example arithmetic tested during preparation. No named human expert review or professional credential is claimed. Read our editorial standards and limitations.