
Read the document behind the headline
To research an NSE company announcement, locate the issuer's filing, identify the document type, preserve its publication timestamp and read the attached information in context. For financial results, check the reporting period, units, standalone or consolidated basis, and audit or review status before calculating a growth rate.
That sounds basic until a headline combines the wrong columns. A quarterly number compared with a year-to-date number can produce a dramatic but meaningless change. A figure reported in lakhs can be mistaken for crores. A board-meeting notice can be read as though it were the outcome of the meeting. None of these mistakes requires sophisticated financial modelling; all can invalidate the conclusion.
NSE provides separate entry points for corporate announcements and financial results. SEBI also maintains a directory pointing investors to exchange filing resources. These are starting points for locating documents, not substitutes for reading the issuer's actual disclosure. [S1] [S2] [S3]
Give each document a job
A board-meeting intimation tells you that a meeting has been scheduled to consider particular matters. An outcome announcement tells you what was disclosed after the meeting. A results statement, investor presentation and conference-call transcript may discuss the same period, but they are different documents with different levels of detail and different purposes.
Build a small document map before extracting numbers. Put the financial statement at the centre for reported figures. Use the presentation to understand how management frames those figures. Use the transcript to identify explanations, uncertainties and questions asked by participants. Then return to the filing whenever the wording appears stronger than the numerical evidence.
Do not infer completion from an announcement of intent. A proposal, approval, signed agreement and completed transaction are different stages. Read the verbs, conditions and dates carefully. A research memo should retain the actual status rather than compressing every stage into the word done.
An exchange-hosted disclosure is also not an exchange guarantee of the company's statements. NSE's corporate-filings page explains its dissemination role and attributes responsibility for uploaded information to the company. [S4] That distinction is why source provenance and independent interpretation both matter.
Keep three clocks separate
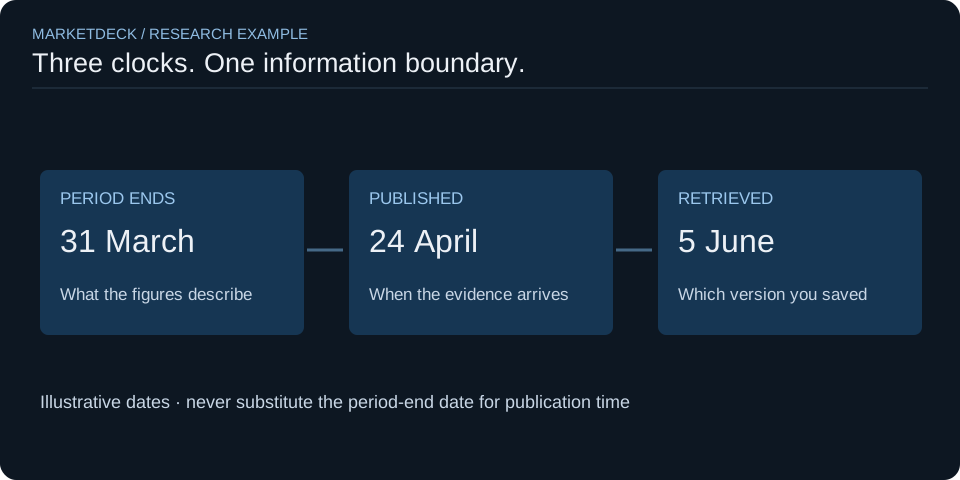
The first clock is the period covered by the information. A quarter may end on 31 March. The second is when the document became publicly available. The third is when you retrieved it. These times answer different questions and should occupy different fields in your notebook.
Consider a hypothetical results document for a March quarter that is published in late April. You download it in June. An analysis of what investors could know in early April cannot use that document simply because its financial figures describe March. The reporting period does not make the information available before publication.
For a current research memo, retrieval time helps you explain which version you consulted. For a historical event study, publication time helps determine when the information could enter the research process. Where a precise timestamp is not available or its meaning is unclear, record that uncertainty instead of inventing minute-level precision.
Store the timezone as well as the time when it matters. Avoid silently comparing an Indian exchange timestamp with a chart using a different timezone. A mismatch of a few hours can place an event on the wrong side of the market session and reverse the apparent sequence.
Inspect the header before the income statement
A real example makes this concrete. The exchange-hosted Infosys consolidated integrated filing approved on 23 April 2026 identifies INR as the currency, lakhs as the rounding unit, a fourth-quarter reporting period, a consolidated basis and audited status. Its table separates the three-month period from year-to-date figures. We use those header fields to demonstrate the reading method, not to offer a view on Infosys shares. [S5]
The corresponding standalone filing is separately labelled. [S6] Treat it as a different reporting scope, not as a duplicate you can casually substitute into a time series. The word profit is incomplete without knowing whose profit, over what period, under which scope and in which units.
Create a header check in your extraction sheet: entity, symbol, period start, period end, currency, unit, scope, status and source URL. Fill it before entering revenue or earnings. This small discipline is particularly useful when you compare several companies with differently formatted statements.
If a PDF and a structured table appear to disagree, do not choose the value that fits your story. Check whether one is amended, whether you selected a different scope, and whether rounding or unit conversion explains the difference. Keep the discrepancy visible until it is resolved.
Convert lakhs and crores without changing the meaning
One crore equals 100 lakhs. Therefore an amount of 12,500 lakhs equals ₹125 crore, not ₹12,500 crore. The conversion changes the displayed unit, not the economic quantity. Record both the original unit and the converted value so another reader can trace the transformation.
Per-share values need separate handling. Do not apply a blanket lakhs-to-crores conversion to earnings per share because the surrounding table reports other values in lakhs. Read the row label and any unit note. A table can legitimately contain both aggregate amounts and per-share quantities.
| Hypothetical field | Original presentation | Correct research treatment |
|---|---|---|
| Revenue | 12,500 lakhs | ₹125 crore |
| Previous comparable revenue | 10,000 lakhs | ₹100 crore |
| Revenue growth | Same scope and period length | 25% |
| Earnings per share | ₹8 per share | Keep ₹8 per share; do not divide by 100 |
Also inspect signs, parentheses and dashes. Parentheses may indicate a negative value under the document's convention. A dash or blank should not automatically become zero. Store unavailable, not applicable and zero as distinct states where the source supports that distinction.
Compare equivalent periods
Year-on-year growth compares a period with the corresponding period a year earlier. Quarter-on-quarter growth compares adjacent quarters. Both can be useful, but they answer different questions. For a seasonal business, a strong sequential comparison may say little about improvement relative to the same season last year.
Suppose hypothetical quarterly revenue rises from ₹100 crore in the prior-year quarter to ₹125 crore in the current quarter. Year-on-year growth is 25%. If the immediately preceding quarter was ₹150 crore, sequential growth is approximately −16.7%. Neither calculation contradicts the other.
Avoid comparing cumulative year-to-date figures with a single quarter. When deriving a quarter by subtraction from cumulative statements, confirm that the periods, accounting scope and versions match. A restatement can make a simple subtraction misleading if one component is revised and the other is not.
Do not annualise a single exceptional quarter without a stated assumption. Multiplying a quarterly number by four is arithmetic; claiming that the result represents normal annual earning power is an additional judgement. Label that judgement and test it against seasonality, one-offs and the longer history.
Standalone and consolidated: define the research perimeter
Standalone statements concern the reporting entity on its own under the applicable framework. Consolidated statements present a group under consolidation rules. For the specific Indian filing you are reading, use its labels and notes to understand what is included. The paired filings cited above illustrate why both versions can exist for the same issuer and period. [S5] [S6]
For a diversified group, a subsidiary may materially change the operating picture. A comparison based on the parent's standalone revenue can answer a different question from one based on the group's consolidated revenue. That does not make either figure wrong; it makes unlabeled substitution wrong.
Keep the perimeter consistent through time. Acquisitions, disposals and changes in the group can affect comparability even within a series labelled consolidated. Read the notes explaining changes rather than assuming every growth rate is entirely organic.
When analysing equity earnings, inspect the relevant attribution and per-share lines rather than substituting total comprehensive income for profit attributable to the shareholders you are studying. The labels matter. A precise calculation applied to the wrong accounting line is still the wrong calculation.
Read notes, segment information and assurance language
Do not stop at revenue and net profit. Read the disclosures accompanying the results for exceptional items, changes in accounting estimates or presentation, segment developments and qualifications or emphasis relevant to interpretation. Do not infer that the absence of a striking headline means those sections are unimportant.
Audit and review descriptions should be reported accurately. Check the status attached to the particular period and document rather than assuming that all columns share the same status. Do not describe unaudited interim information as audited because an annual statement elsewhere was audited.
Segment information can help explain a group result that hides divergent operations. A stable group margin might combine one improving segment with another deteriorating segment. Before attributing the overall change to a single driver, inspect the available breakdown and the allocation of unallocated items.
Record what is not disclosed as well. A presentation may emphasise an order pipeline without providing timing, cancellation risk or cash-collection detail. Missing information should become a follow-up question, not a blank filled with an optimistic assumption.
Build an announcement-to-research workflow
Begin with a claim you want to investigate. Locate the issuer's announcement and the underlying attachment. Save the source URL, document title and relevant dates. Extract only the facts needed for the question, retaining units and scope. Then write a separate paragraph explaining what those facts might imply.
Cross-check the most important values against a second presentation of the same primary information where possible, such as the attached statement and structured filing. This can catch extraction errors. It does not create a second independent economic source when both displays originate from the same company document.
Use MarketDeck Commentary to explore how a company or topic is being discussed, then follow the underlying evidence. Use StockProof for the quantitative research lens. Neither step should erase the original filing trail. The stock-screening guide explains how ratios become more useful once their components can be verified.
Finally, save a concise result: confirmed facts, interpretation, uncertainties and the next document that could change the analysis. The five-lens checklist provides a structure for that memo. A good research record should become easier—not harder—to challenge as it grows.
Frequently asked questions
Where should I find an NSE company's official results?
Start with NSE's financial-results or corporate-announcements resources and open the issuer's attachment or structured filing. Confirm the company, period and version. A headline or search snippet is useful for discovery but is not the complete results statement.
Is the board-meeting date the same as the reporting-period end?
No. The reporting period describes the financial activity being reported; a board-meeting or publication date relates to the process of approving or releasing that information. Keep those fields separate, especially when studying historical price reactions.
What should I do when two financial-data websites disagree?
Compare the underlying filing, scope, period, unit and metric definition. Check for amendments and different update times. Do not average the two numbers or assume that the more precise display is correct. Preserve the discrepancy until you can explain it.
THE EVIDENCE DESK
Sources and scope
Primary documents, provider documentation and research papers are linked below. The examples are synthetic or explicitly identified; no live return, investment outcome or independent research replication is claimed.
- S1 NSE: Corporate Announcements ↗
Official issuer-disclosure discovery resource. Reviewed 2026-09-23.
- S2 NSE: Financial Results ↗
Official financial-results discovery resource. Reviewed 2026-09-23.
- S3 SEBI: Corporate Filings Resource Directory ↗
Directory of exchange filing resources, not current legal advice. Reviewed 2026-09-23.
- S4 NSE: Corporate Filings ↗
Exchange dissemination disclaimer and filing categories. Reviewed 2026-09-23.
- S5 NSE-hosted Infosys consolidated integrated filing, 23 April 2026 ↗
Header fields only used as a real example; not a stock recommendation. Reviewed 2026-09-23.
- S6 NSE-hosted Infosys standalone integrated filing, 23 April 2026 ↗
Separate reporting scope; no investment opinion or actual amount comparison. Reviewed 2026-09-23.
This is AI-assisted educational writing published by MarketDeck. Sources were checked and worked-example arithmetic tested during preparation. No named human expert review or professional credential is claimed. Read our editorial standards and limitations.