Set the frame
Choose the instrument, timeframe, scale and adjustment before interpreting the shape.
Begin with this guide →CHARTS / TECHNICALS
A chart is a compressed record of transactions. Learn to read what is visible first, choose a timeframe deliberately, and separate an observation from a prediction.
FEATURED GUIDE / START HERE
Learn to read stock charts with the right timeframe, scale and adjustments. Worked examples explain dividends, drawdowns and misleading comparisons.
Read the complete guide →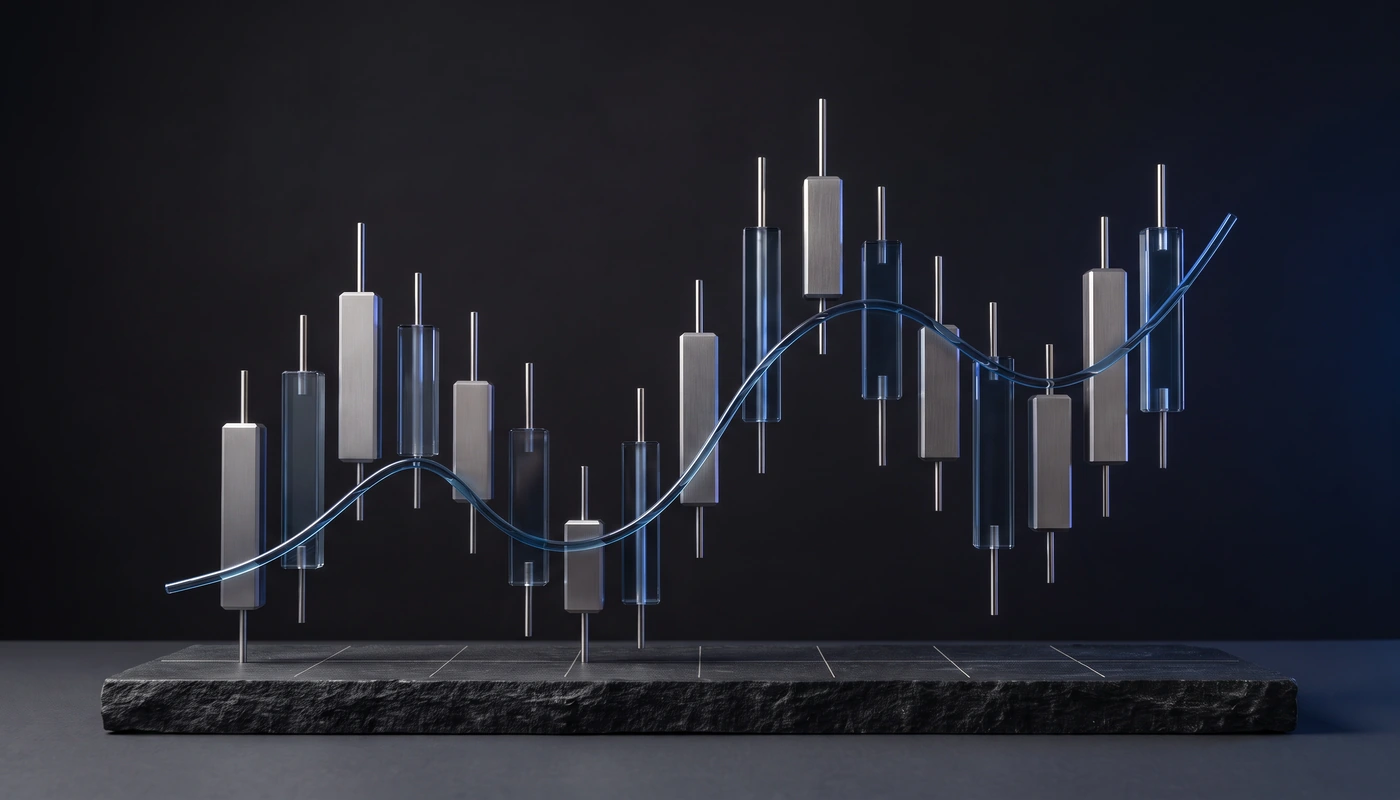
START HERE
Choose the instrument, timeframe, scale and adjustment before interpreting the shape.
Begin with this guide →Mark trends and support/resistance as areas where behaviour changed—not magic prices.
Explore this step →Use volume, corporate events and other evidence without turning one indicator into certainty.
Explore this step →CORE CONCEPTS
Learn stock charts from first principles: timeframe, scale, support and resistance, volume and the evidence behind a technical view.
PUBLISHED GUIDES
Technical Analysis
Learn to read stock charts with the right timeframe, scale and adjustments. Worked examples explain dividends, drawdowns and misleading comparisons.
Read the guideTechnical Analysis
Learn support and resistance step by step with zones, repeated tests, breakouts, volume context and beginner mistakes using simple Indian-market examples.
Read the guide