
The same valuation, read from two directions
P/E ratio and earnings yield use the same two ingredients—price and earnings—but put them in opposite order. P/E asks how many rupees of price investors are paying for one rupee of annual earnings. Earnings yield asks how many rupees of annual earnings the current price represents for every ₹100 invested. For a beginner, that makes earnings yield a useful translation rather than a different valuation model. [S4]
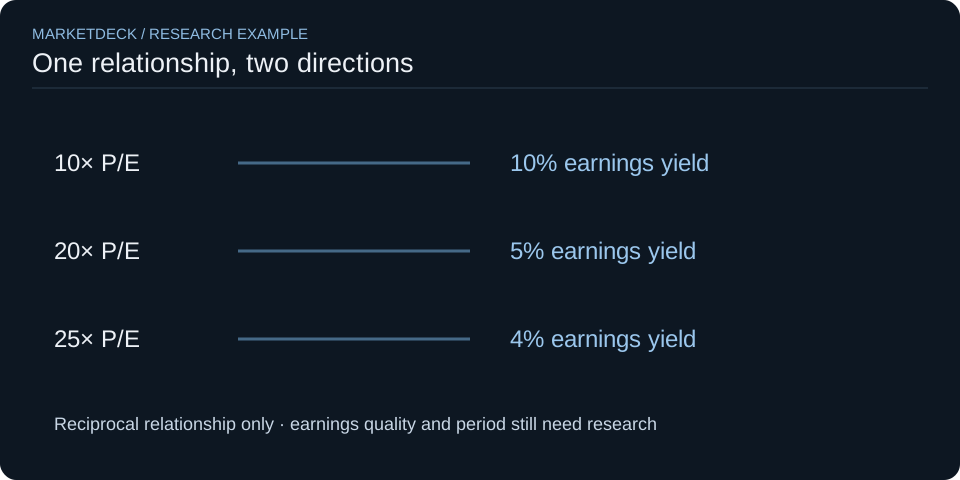
If a share trades at ₹300 and earnings per share are ₹15, the P/E ratio is 20. The earnings yield is 15 divided by 300, or 5%. If the P/E is positive, you can also move between the two by taking the reciprocal: earnings yield is approximately 1 divided by P/E. A P/E of 20 therefore corresponds to an earnings yield of 5%.
P/E and earnings yield do not disagree. They are two ways of describing the same price-to-earnings relationship.
Start with the denominator before comparing two stocks
The most common mistake is comparing two P/E numbers without checking what “earnings” means. One website may use trailing twelve-month earnings, another the latest financial year, and another a forward analyst estimate. A consolidated company result may differ from the standalone parent. A one-off gain can temporarily lift earnings. The ratio inherits every weakness of the denominator.
For Indian companies, the safest workflow is to record the price date, the earnings period, and whether the financials are standalone or consolidated. NSE’s financial-results portal is one official route to the underlying disclosures. [S1] MarketDeck’s guide to reading NSE announcements and results explains why the publication date and reporting period should remain separate.
Suppose Company A trades at ₹400 and reports ₹20 of earnings per share for the latest comparable year. Company B trades at ₹250 and reports ₹10. Their P/E ratios are 20 and 25. Their earnings yields are 5% and 4%. The arithmetic is simple; the research question is whether those earnings are equally repeatable.
P/E is a price multiple, not a quality score
A lower P/E can mean many things. The market may expect slower growth. Earnings may be temporarily high. The business may face more debt, cyclicality, governance risk, customer concentration, or reinvestment problems. A higher P/E can reflect stronger expectations, but expectations can also be too optimistic.
That is why “low P/E = cheap” is not a complete rule. The ratio describes what the market price is relative to a chosen earnings number. It does not prove that the earnings are sustainable, that the company is financially strong, or that the share price will rise.
The SEC’s beginner guide to financial statements is a useful general explanation of how the income statement, balance sheet and cash-flow statement fit together, although Indian reporting requirements must be checked from Indian sources. [S2] Before trusting the earnings number, ask whether profit is supported by cash generation, whether debt has changed materially, and whether the company needed much more capital to produce the growth.
Earnings yield can make comparisons easier to read
Percentages are often easier to compare with other rates than multiples. A P/E of 12.5 corresponds to an earnings yield of 8%. A P/E of 25 corresponds to 4%. This can help a reader understand how much current earnings sit behind the price.
But earnings yield is not the same as a bond yield, dividend yield, or guaranteed return. The company does not promise to distribute those earnings to shareholders. Future earnings can fall. The share price can fall even when the current earnings yield looks high. The percentage is simply current earnings divided by current equity price under the selected earnings definition.
| Hypothetical share | Price | EPS | P/E | Earnings yield |
|---|---|---|---|---|
| A | ₹400 | ₹20 | 20.0 | 5.0% |
| B | ₹250 | ₹10 | 25.0 | 4.0% |
| C | ₹180 | ₹18 | 10.0 | 10.0% |
Company C looks cheapest on this snapshot, but the table says nothing about why its multiple is lower. That “why” is the next research step.
Why cyclical companies can look cheapest near peak earnings
Imagine a commodity producer earning ₹30 per share during an unusually strong year while its share price is ₹300. Its P/E is 10 and earnings yield is 10%. If earnings later normalize to ₹15 while price initially remains ₹300, P/E becomes 20 and earnings yield falls to 5%.
Nothing about the price changed in that example. Only the earnings denominator changed. This is why a low P/E at peak profitability can be misleading for cyclical businesses. Instead of asking only “what is the current P/E?”, ask where current margins and earnings sit relative to a normal cycle.
A practical beginner check is to look at several years of revenue, operating margin, profit and cash flow before treating the latest year as representative. Use MarketDeck StockProof to inspect available company fundamentals, then verify important figures against original filings.
Loss-making companies need a different lens
When earnings are zero or negative, a conventional positive P/E ratio stops being meaningful. A negative reciprocal does not suddenly create a useful valuation signal. The company may still have value, but you need other questions: revenue quality, gross margins, cash burn, balance-sheet strength, unit economics, assets, or a path to sustainable profit.
Do not force every company into the same metric. Banks, insurers, commodity producers, asset-heavy manufacturers and fast-growing software businesses have different economic structures. A useful ratio is one whose numerator and denominator match the business question.
Trailing and forward P/E answer different questions
Trailing P/E uses already-reported earnings. Its strength is that the denominator comes from historical results. Its weakness is that the business may have changed since those results were earned.
Forward P/E uses expected future earnings. That can be more relevant to the future, but it introduces forecast risk. Two analysts can reasonably use different assumptions. A forward multiple should therefore carry the estimate source and forecast period beside it.
For a new investor, trailing numbers are usually easier to verify. Start there, understand the business, and treat forecasts as scenarios rather than facts. MarketDeck does not need to turn a forecast into a precise target to make it useful.
A simple way to compare two companies without overreaching
First, make sure the companies are reasonably comparable. Then record the same earnings basis for both. Third, compare P/E and earnings yield side by side. Fourth, inspect profitability, cash conversion, debt and growth. Finally, write one sentence explaining why the valuation difference might exist.
For example: “Company A trades at 20× trailing consolidated earnings versus Company B at 25×; A has the higher earnings yield, but B has shown stronger revenue growth and lower working-capital needs.” That is a research statement. “Company A is definitely undervalued” would require much more evidence.
The Indian stock-screening guide provides a fuller workflow for ROCE, cash flow and valuation. Use the Equities learning hub to move from ratios into financial statements and company-result analysis.
When the reciprocal shortcut can mislead
The reciprocal relationship works cleanly only when you are using the same positive earnings number. A quoted P/E rounded to one decimal can produce a slightly different reciprocal from a separately calculated earnings yield. Different data providers may use different share counts, adjustments, or periods.
Also avoid comparing an earnings yield based on accounting profit directly with a risk-free interest rate and calling the difference an “equity risk premium.” A proper valuation comparison requires growth, duration, risk and cash-flow assumptions. The shortcut can be a useful intuition tool; it is not a complete valuation model.
A beginner checklist before using P/E
- Is the earnings period clearly identified?
- Are the numbers standalone or consolidated?
- Are earnings positive and reasonably representative?
- Did a one-off item materially change profit?
- Is the company cyclical?
- Is cash generation broadly consistent with accounting profit over time?
- Are you comparing similar businesses on the same basis?
- Can you explain why the market might assign different multiples?
NSE’s corporate-announcement pages can help locate disclosures that explain unusual earnings or business changes. [S3] The important step is to follow the ratio back to the company evidence rather than treating the multiple as an isolated verdict.
Frequently asked questions
Is earnings yield better than P/E?
No. For positive earnings they express the same relationship in opposite directions. Use whichever form makes the comparison easier to understand, then investigate the quality and sustainability of the earnings.
What earnings yield corresponds to a P/E of 20?
Approximately 5%, because 1 divided by 20 equals 0.05. That 5% is not a promised shareholder return or dividend; it is current earnings divided by current price under the selected earnings definition.
Does a low P/E mean a stock is undervalued?
Not by itself. A low multiple may reflect weak growth expectations, cyclical peak earnings, business risk, debt or other concerns. Compare the denominator, business quality, cash flow and assumptions before drawing a valuation conclusion.
THE EVIDENCE DESK
Sources and scope
Primary documents, provider documentation and research papers are linked below. The examples are synthetic or explicitly identified; no live return, investment outcome or independent research replication is claimed.
- S1 NSE: Financial Results ↗
Official financial-results discovery resource; verify the company document and reporting basis. Reviewed 2026-09-23.
- S2 SEC: Beginners’ Guide to Financial Statements ↗
General educational financial-statement framework; not Indian filing law. Reviewed 2026-09-23.
- S3 NSE: Corporate Announcements ↗
Official issuer-disclosure discovery resource for events affecting earnings context. Reviewed 2026-09-23.
- S4 SEC Investor.gov: Price-Earnings (P/E) Ratio ↗
Official investor-education definition of price divided by earnings per share; earnings-yield reciprocals below are original hypothetical calculations. Reviewed 2026-09-23.
This is AI-assisted educational writing published by MarketDeck. Sources were checked and worked-example arithmetic tested during preparation. No named human expert review or professional credential is claimed. Read our editorial standards and limitations.