
A busy protocol is not automatically a valuable token
Crypto fundamental analysis starts by separating the network or application's activity from the economic position of its token. Fees paid by users, revenue retained by a protocol and value distributed to tokenholders are different quantities. A large number in one category does not establish a large number in the others.
For an India-based researcher, the task is not simply to translate a global token price into rupees. You need to understand what the protocol does, how the data provider defines its metrics, which rights or mechanisms connect activity to the token, and which risks remain outside the dashboard. This guide provides a worked framework rather than a list of tokens to buy.
All financial amounts below are hypothetical. They are not current market data, project valuations or tax calculations. References identify provider definitions and technical mechanics; the analytical checklist and scenarios are MarketDeck's original educational framework.
Begin with the product and its users
Describe the service before calculating a ratio. Does the system facilitate exchange, lending, payments, settlement, data availability or another activity? Who chooses to use it, who pays, and what alternatives exist? A token can be actively traded even when its associated service has limited use.
Separate usage from incentives. If participation is subsidised with token rewards, ask what behaviour remains when those rewards change. A rising activity count can reflect genuine demand, repeated activity by a small group, automated interactions or a short-lived incentive programme. The count alone does not distinguish among them.
Define the unit of observation. An address is not necessarily one person, a transaction is not necessarily one customer purchase, and trading volume is not necessarily fee revenue. Write the metric's definition beside it. This avoids importing familiar business language into a system where the unit is different.
Then identify the measurement boundary. A project may operate on several chains or across multiple versions. Check whether the provider aggregates them, excludes some components or counts related activity in more than one place. A comparison is only useful when the boundaries are understood.
Fees, protocol revenue and tokenholder revenue
DefiLlama defines fees as amounts paid by users, revenue as the subset retained by the protocol rather than passed to service providers such as liquidity providers, and holders revenue as value channelled to tokenholders through specified mechanisms. These are provider definitions; the project-specific implementation still needs checking. [S1]
Construct a simple hypothetical waterfall. Users pay $100 in fees. Service providers receive $70. The remaining $30 is protocol revenue under our example's definition. Of that $30, $20 goes to a treasury and $10 is allocated to a tokenholder mechanism. Calling the entire $100 tokenholder earnings would collapse three distinct stages.
| Hypothetical flow | Amount | Research question |
|---|---|---|
| Fees paid by users | $100 | Is the activity repeatable and economically meaningful? |
| Paid to service providers | $70 | What resources does the service require? |
| Retained protocol revenue | $30 | Who controls the retained value? |
| Treasury allocation | $20 | How can it be spent or redirected? |
| Tokenholder allocation | $10 | Who qualifies, and through what mechanism? |
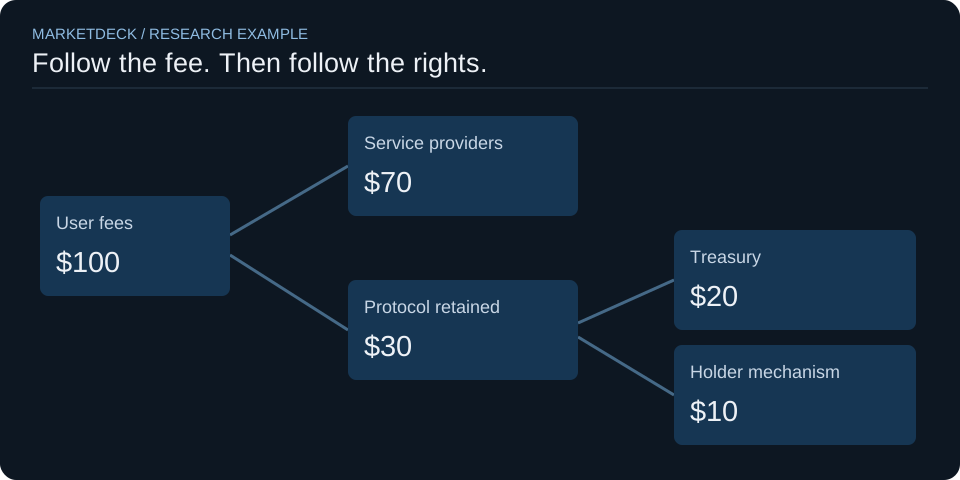
Check whether the allocation is actually operating, merely proposed, or subject to change. A governance discussion about future fee sharing is not equivalent to an implemented distribution. Record the mechanism's effective date and revisit it when the protocol changes.
Do not automatically equate these data categories with audited corporate revenue, net income or a shareholder dividend. Off-chain expenses, legal arrangements and accounting boundaries may differ. A useful comparison explains those differences rather than hiding them behind a familiar ratio label.
Follow the mechanism from activity to the token
Ask how the token is connected to the service. It might be used to pay for resources, secure the network, govern parameters or participate in a particular distribution. Those functions are not interchangeable, and some require actions or risks beyond simply holding the token.
Ethereum's technical documentation illustrates the need for specificity: its gas-fee explanation distinguishes a base fee that is burned from a priority fee paid to the validator. That is a concrete network mechanism, not a generic statement that all transaction fees become income to every ETH holder. [S2]
For another protocol, build its own mechanism map. Identify the payer, recipient, treasury, service provider and tokenholder separately. If a buyback is relevant, ask where the funding originates and how purchased tokens are handled. If rewards require staking or locking, document the conditions and associated exposure.
Then challenge the inference. Even when activity creates a token-related benefit, the market price can already reflect optimistic expectations, token supply can change, and other risks can dominate. The mechanism explains one channel of value capture; it does not establish a future return.
Market capitalisation and fully diluted valuation
Market capitalisation is commonly calculated as price multiplied by circulating supply. Fully diluted valuation applies the price to a broader supply measure, often total or maximum supply depending on the provider and asset. CoinGecko explains both conventions and notes that market capitalisation is not the amount of money invested in the asset. [S3]
Consider a hypothetical token priced at $2 with 50 million circulating units and 100 million units under the chosen diluted-supply definition. Circulating market capitalisation is $100 million; the corresponding FDV is $200 million. These are price-times-supply calculations, not two independently observed piles of money.
If circulating supply later rises to 75 million with price unchanged, circulating market capitalisation becomes $150 million. That arithmetic does not imply that $50 million of new cash entered the market. Nor does it predict that price will remain unchanged when the additional units become tradable.
Read the supply schedule rather than treating the gap as a complete risk score. Who receives new units, when are restrictions removed, and what mechanisms can alter future issuance? A large gap raises questions about dilution and ownership concentration; it does not mechanically determine the timing or size of a price move.
Use valuation ratios only after defining the denominator
A token's market-cap-to-fees ratio and market-cap-to-protocol-revenue ratio can differ dramatically. In a hypothetical annual example, market capitalisation is $120 million, user fees are $24 million and protocol revenue is $6 million. The two ratios are 5 and 20 respectively. Calling both price-to-sales would conceal the difference.
If tokenholder allocation is $1.2 million, market capitalisation divided by that allocation is 100. This does not make it directly comparable to an equity P/E of 100. The allocation mechanism, eligibility, risks, supply changes and accounting treatment may be fundamentally different.
Always label the time window. A trailing twelve-month sum is not the same as last month's fees multiplied by twelve. Annualising a brief burst of activity can make a protocol appear cheaper exactly when the denominator is least representative. Keep the unannualised observed amount alongside any extrapolation.
Use scenarios rather than a single attractive ratio. What happens if activity falls, service-provider costs rise, or the share retained by the protocol changes? Sensitivity analysis is useful because it shows which assumption carries the conclusion. It is not a licence to assign unsupported probabilities.
TVL, deposits and the price effect
Total value locked is a value measure attached to assets within a provider's defined protocol boundary. DefiLlama explicitly warns that changes in asset prices can move TVL even when deposit flows move in the opposite direction. [S1] A rising dollar TVL therefore does not, by itself, show new users depositing more assets.
In a simplified example, a protocol holds 1,000 units of an asset worth $100 each. TVL is $100,000. If the asset price rises to $120 with the quantity unchanged, TVL becomes $120,000 without a new deposit. If some units leave while the price rises, the dollar total can still look stable.
Inspect quantity changes, price changes and net flows separately where data permit. Also read how borrowed assets, recursive positions or assets deposited through other protocols are treated. Aggregating headline values without understanding overlap can overstate the independent capital represented.
Treat data-provider definitions as part of the research record. Token Terminal's metrics documentation emphasises both general definitions and project-specific context. [S4] Save the exact metric name, provider, project coverage and retrieval date rather than copying a number into a spreadsheet with a vague heading such as revenue.
Add liquidity, governance and technical risk
Fundamentals are not exhausted by usage and revenue. Ask how a position could be valued and exited under stressed conditions, which markets provide observable prices, and whether headline volume corresponds to usable depth. A large market-cap figure is not a promise of liquidity at that valuation.
Review the project's control structure. Who can upgrade contracts, change parameters, pause activity or redirect fees? Distinguish documented powers from assumptions about decentralisation. A governance token's existence alone does not reveal who can exercise effective control.
Technical reviews and audits should be read for their scope, date and limitations. A report about one contract version does not automatically cover later upgrades or every dependency. Do not describe audited as risk-free. Record what was reviewed and what remains outside the review.
Consider dependencies such as price feeds, bridges, stablecoins and external service providers where relevant. A protocol can appear diversified at the interface while relying on a small set of underlying components. Draw the dependency chain rather than counting only the visible products.
Make the research India-aware without mixing questions
For a rupee-based comparison, state the currency conversion source and time. A USD-denominated protocol metric converted using one date's exchange rate should not be casually compared with another series converted at different dates. Keep original-currency values available so the conversion can be checked.
Separate global protocol analysis from India-specific access, tax and compliance questions. The former does not answer the latter. This article does not provide current tax rates or filing instructions; consult applicable official guidance and qualified advice for your circumstances rather than carrying forward an old blog's rule.
Use MarketDeck Crypto World to explore available market and research views, checking each figure's source and freshness. The workflow here is a research standard, not a claim that every metric or protocol described is covered in the application.
The five-lens memo can be adapted to keep observations, interpretations and open risks separate. Readers familiar with shares should also review equity screening to see why useful analytical habits transfer while legal rights and accounting denominators may not.
Frequently asked questions
Are protocol fees the same as revenue for tokenholders?
No. Fees can be distributed among several participants before any value reaches a tokenholder mechanism. Check the provider's definition, the actual allocation and whether receiving that value requires staking, locking or another action. A proposed mechanism is not the same as an operating one.
Does low FDV relative to fees prove a token is cheap?
No. The comparison omits the quality and persistence of fees, costs, token rights, supply changes and risk. It is a starting point for questions, not a valuation verdict. A ratio becomes more useful when its numerator, denominator and limitations are explicit.
Can TVL rise without new money entering a protocol?
Yes. The price of assets already deposited can rise while quantities remain unchanged. A TVL chart combines a valuation effect with changes in the assets counted. Examine flows and quantities separately where reliable data are available.
THE EVIDENCE DESK
Sources and scope
Primary documents, provider documentation and research papers are linked below. The examples are synthetic or explicitly identified; no live return, investment outcome or independent research replication is claimed.
- S1 DefiLlama: Data Definitions ↗
Provider definitions of fees, revenue, holders revenue and TVL. Search-rendered public definition text reviewed; direct page extraction was unavailable. Reviewed 2026-09-23.
- S2 Ethereum: Gas and Fees Technical Overview ↗
Base-fee burn and priority-fee distinction, not a token return forecast. Reviewed 2026-09-23.
- S3 CoinGecko: What Is Market Cap in Crypto? ↗
Supply and valuation conventions; no current prices or cap figures reused. Reviewed 2026-09-23.
- S4 Token Terminal: Metrics Documentation ↗
General and project-specific definitions; not audited corporate accounting. Reviewed 2026-09-23.
This is AI-assisted educational writing published by MarketDeck. Sources were checked and worked-example arithmetic tested during preparation. No named human expert review or professional credential is claimed. Read our editorial standards and limitations.