
Two volatility statistics, two different questions
IV rank measures where current implied volatility sits between a chosen historical minimum and maximum. IV percentile measures how many comparable historical observations were below the current value. They can disagree sharply because the first depends on the extremes and the second on the distribution of observations.
For NIFTY options research, that distinction is useful only after defining the implied-volatility series. The IV of a particular strike and expiry, a constant-maturity at-the-money estimate and a broad index-volatility measure are not interchangeable inputs. A precise percentage calculated from an inconsistent series is still an unreliable comparison.
This guide explains the calculations, an outlier example and the data checks needed before interpreting the result. All numerical values are hypothetical. They are not current NIFTY readings, a backtest or an instruction to buy or sell options.
First define the implied-volatility input
Implied volatility is the volatility input that makes an option-pricing model consistent with an observed option price, given the other model inputs and assumptions. It is not directly observed future volatility. When the option price, expiry, underlying reference or modelling assumptions change, the resulting estimate can change too.
Before building a historical series, specify the instrument, option type, strike-selection rule, tenor and observation time. A series that uses this week's expiry on one day and next month's expiry on another can mix different exposures. A rolling series needs a documented rule for how it transitions.
Record whether the price input is a last trade, bid, ask or midpoint. A stale last trade can tell a different story from a current quote. Wide spreads and missing quotes deserve a data-quality flag, not silent interpolation that produces a smooth-looking signal.
Check the current official contract specifications when selecting an instrument. NSE maintains the relevant derivatives specifications; expiry schedules and contract details should not be copied from an old article and assumed to remain valid. [S1] This guide deliberately avoids hardcoding a current lot size or expiry weekday.
The IV rank formula
For a defined lookback, calculate IV rank as 100 multiplied by current IV minus the historical minimum, divided by the historical maximum minus the historical minimum. The conventional comparison is described in tastylive's educational material, alongside IV percentile. [S2]
Suppose the minimum is 10%, the maximum is 30% and current IV is 20%. The distance above the minimum is 10 percentage points, and the historical range is 20 percentage points. IV rank is therefore 50. It does not mean there is a 50% chance that the option will make money or that realised volatility will equal 20%.
Be consistent about units. Entering 10, 20 and 30 everywhere produces the same rank as entering 0.10, 0.20 and 0.30 everywhere. Mixing the two conventions does not. Display IV with a percent sign, but describe rank as a relative statistic whose interpretation depends on the selected history.
There is also a boundary case. If historical maximum equals historical minimum, the denominator is zero. Report the rank as unavailable under this definition rather than inventing a value. If the current observation is excluded from the historical range, a new extreme can produce a rank outside zero to 100; disclose that convention rather than silently clipping the calculation.
The IV percentile formula
In this article, IV percentile is 100 multiplied by the number of valid historical observations strictly below current IV, divided by the number of valid historical observations. We use a strict less-than convention and exclude the current observation from the historical sample.
If 85 of 100 valid observations are below current IV, the percentile is 85. That is a statement about the chosen sample. It is not the probability that IV will fall next, and it does not mean the option is overpriced relative to its future payoff.
Ties need a rule. A provider counting observations less than or equal to current IV can show a different result from one counting strictly lower observations. Some statistical implementations use other rank conventions. Before comparing two platforms, compare the definitions, not just the headline numbers.
Missing data also require a decision. If a nominal lookback contains 100 dates but only 92 valid comparable observations, the denominator under our definition is 92. Save the missing-date count alongside the result. A percentile based on a patchy history should not look indistinguishable from one based on complete observations.
Worked example: one outlier changes the story
Use the following 20 hypothetical historical IV observations, expressed in percent: 10, 11, 12, 12, 13, 13, 14, 14, 15, 15, 16, 16, 17, 17, 18, 18, 19, 20, 22 and 80. Current IV is 20%. The intentionally short sample makes the arithmetic inspectable; it is not a recommendation for a production lookback.
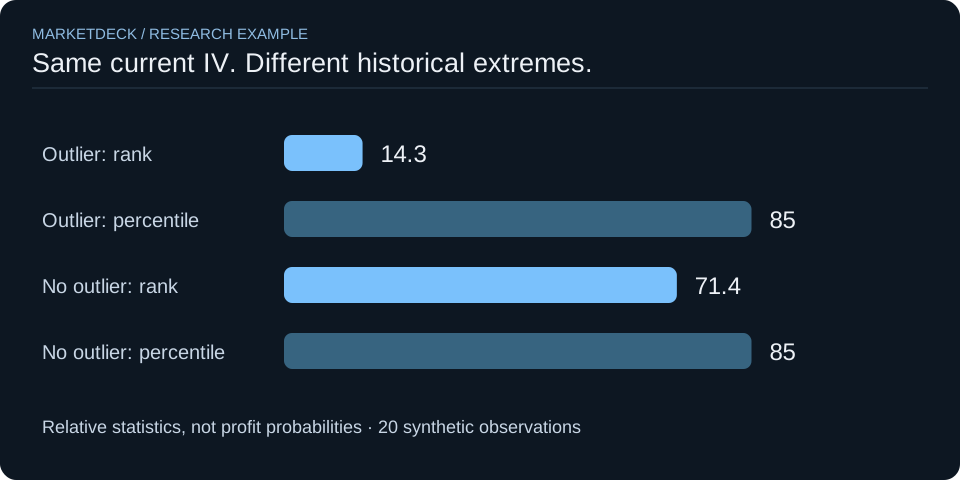
Seventeen observations are strictly below 20, so IV percentile is 85. IV rank is only about 14.3, because the minimum is 10 and the maximum is 80: 100 × (20 − 10) / (80 − 10). Current IV is high relative to most observations but low relative to the full extreme-to-extreme range.
Now replace the isolated 80 observation with 24, leaving everything else unchanged. Seventeen observations are still below 20, so percentile remains 85. Rank rises to about 71.4, because the range is now 10 to 24. The disagreement is not a calculation error. The statistics respond to different features of the history.
| Hypothetical history | Current IV | Minimum | Maximum | IV rank | IV percentile |
|---|---|---|---|---|---|
| Includes one 80% outlier | 20% | 10% | 80% | 14.3 | 85 |
| Outlier replaced with 24% | 20% | 10% | 24% | 71.4 | 85 |
Under a less-than-or-equal convention, the tied historical observation at 20 would also count. The percentile would then be 90 rather than 85. Keep that simple example in mind when two apparently reputable sources disagree by a few points.
What a high reading does not establish
A high relative reading says that the estimate is elevated compared with its own chosen past. It does not prove that selling an option is attractive. Future realised movements, jump risk, costs, liquidity, the chosen payoff and the ability to withstand adverse paths all matter.
Likewise, a low rank does not establish that buying options is attractive. A low estimate can remain low, and an option can lose value through time decay or an unfavourable move even when the opening IV appears modest. A relative-volatility statistic is not a complete expected-return model.
Avoid turning educational thresholds into automatic trade rules. A number above a chosen cutoff might define a research group for later testing. It cannot substitute for a clearly specified strategy, realistic prices, execution assumptions and evidence from an untouched evaluation period.
Separate the descriptive and predictive questions in your notebook. Descriptive: how unusual is this IV reading within the selected history? Predictive: does a specified action taken after such readings improve a defined outcome after costs? The second question requires additional evidence; the first does not answer it automatically.
Make NIFTY comparisons genuinely comparable
Use the same underlying and a stable contract-selection method. Comparing a far-out-of-the-money put with an at-the-money call can mix skew with changes through time. Comparing different maturities can mix term structure with changes in the overall volatility environment.
A practical research record might state: an at-the-money estimate at a defined observation time, with a documented tenor-selection or interpolation rule. The exact method depends on available data. Do not describe a simple nearest-expiry series as constant maturity unless you actually construct it that way.
Keep observation time consistent. A morning quote and a closing quote can reflect different information and liquidity. Where there are gaps, record the gap and avoid filling it from a later observation. Historical research must use information available at the decision time.
Use NSE's option-chain page as an official reference surface, while reading its displayed conventions and notes. [S3] A downloaded snapshot is still a snapshot: save its time and relevant contract fields. Do not assume that a current page can reconstruct what was observable on an earlier date.
Choose a lookback for a reason
A longer history gives more context but may combine different market environments. A shorter history responds more quickly to recent conditions but has fewer observations and can be sensitive to a single episode. There is no lookback that removes this trade-off.
Choose the lookback before evaluating outcomes and record why it fits the question. You can inspect a small set of predeclared alternatives for sensitivity, but keep the comparisons visible. Searching many windows and reporting only the best one introduces a selection problem.
Pay attention to the difference between a time window and an observation count. One calendar year does not imply a fixed number of valid quote observations. Holidays, missing data and filters can alter the sample. Publish the actual count used in the denominator.
Consider saving both rank and percentile, together with current IV, minimum, maximum and valid count. This small context table can reveal why the metrics diverge. It is often more informative than a single coloured label saying high or low.
A reproducible volatility research workflow
First define the series and save a dated snapshot of its construction rules. Next validate quotes, contract identity and missing observations. Then compute both statistics with the conventions specified above. Check the result manually on a small sample before applying the calculation to a larger history.
Review large changes in the metrics. Did current IV move, did an extreme leave the rolling window, or did the contract-selection rule change? A jump in rank can arise without a comparably large change in current IV when the historical range changes.
Use MarketDeck F&O to explore the available options research tools, but verify the displayed metric definitions and coverage before equating them with the example here. This article explains an analytical method; it does not assert that a particular live dataset or custom series is already available in the application.
For a broader review, connect the volatility observation to the research memo checklist and the guide to reading chart context. Keep the option statistic, the price observation and the narrative explanation separate until the evidence supports combining them.
Frequently asked questions
Which is better: IV rank or IV percentile?
Neither is universally better. Rank describes position within the historical range; percentile describes position among observations. Saving both, with their inputs and sample definition, is usually more informative than selecting one solely because its number supports a preferred conclusion.
Can IV percentile be high when IV rank is low?
Yes. The worked example has percentile 85 and rank approximately 14.3 because a single large historical outlier stretches the range. Most observations remain below current IV even though current IV is near the bottom of that stretched range.
Does an IV percentile of 80 mean volatility will fall with 80% probability?
No. It describes the proportion of the chosen historical sample below the current observation, under the stated convention. It is not a calibrated forecast of the next move, an option's probability of profit or a recommendation to sell volatility.
THE EVIDENCE DESK
Sources and scope
Primary documents, provider documentation and research papers are linked below. The examples are synthetic or explicitly identified; no live return, investment outcome or independent research replication is claimed.
- S1 NSE: Equity Derivatives Contract Specifications ↗
Check current contract details; no expiry weekday or lot size assumed. Reviewed 2026-09-23.
- S2 tastylive: Implied Volatility Rank and Percentile ↗
Metric definitions; no automatic trade recommendations adopted. Reviewed 2026-09-23.
- S3 NSE: Option Chain ↗
Official reference surface; no historical reconstruction or live quote claim. Reviewed 2026-09-23.
This is AI-assisted educational writing published by MarketDeck. Sources were checked and worked-example arithmetic tested during preparation. No named human expert review or professional credential is claimed. Read our editorial standards and limitations.