THE MARKETDECK BRIEF / FIELDNOTES 02 / PAGE 1
The agentic trading frontier
Smarter agents. Harder questions.
Inside the September issue
Tool-using teams, adaptive policies, hybrid strategies and the evidence behind the headlines. A visual field guide to the systems changing market research.
START HERE / EDITOR'S NOTE / PAGE 2
The system is the story.
A market agent is not just a model with a buy button. It is a chain of decisions, tools and permissions.
Read the frontier, not the hype
This edition keeps the original brief's eight themes and turns them into a working magazine: research context, visual explanations, source-labelled charts and a notebook you can fill in. The organizing question is simple: what changes when a model can do something with its answer?
Three lenses for every claim
First, examine the architecture: which component gathers evidence, calculates a value or authorizes an action? Next, examine the experiment: was it a historical simulation, a live-price evaluation or real capital? Finally, examine the limit: what was not tested? These are different questions, and a convincing result needs all three.
How to use the digital edition
Click any contents row to jump. Footer links return to contents, sources or the web article. Blue source IDs open the reference page. The last working page contains editable notes and checkboxes; save your own copy in a form-capable PDF reader. No JavaScript, tracking or submission endpoint is included.
01 / WHAT CHANGED / PAGE 3
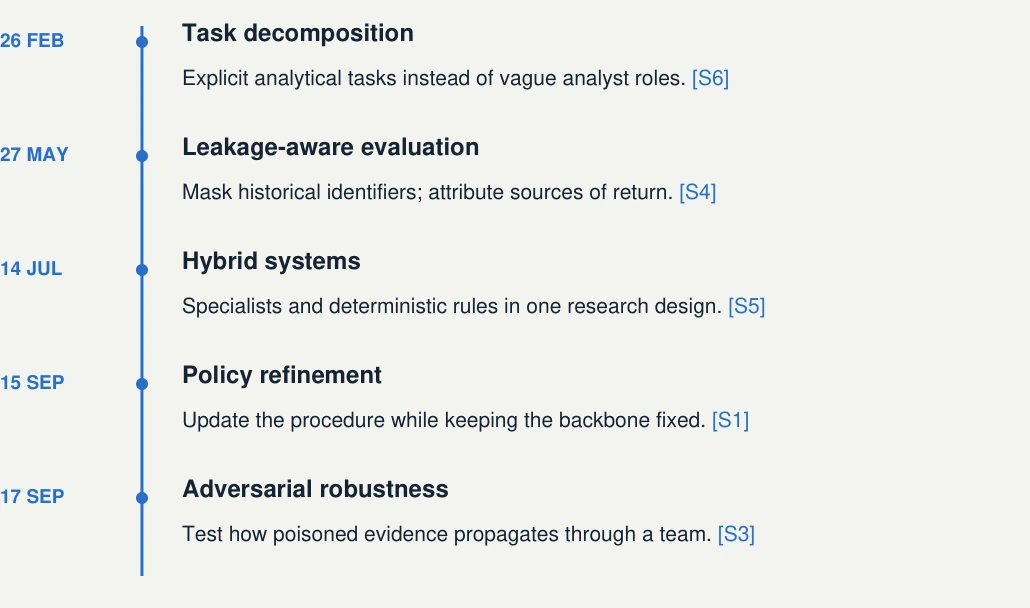
Five signals from 2026.
The research conversation is moving from better predictions to better decision processes.
The common thread
Task decomposition, memory controls, hybrid pipelines, policy revision and adversarial testing attack different weaknesses in the same system. None makes the other checks redundant. A more capable reasoning model still needs an honest data cut, an explicit objective and a bounded set of actions.
What the dates do not prove
This is a selected research timeline, not a census of the industry. A new paper is evidence that a problem is being studied; it does not establish adoption, independent replication or an investable edge. Read the study design before treating publication recency as progress.
02 / SPECIALIST TEAMS / PAGE 4
Give every agent a job.
Useful specialization starts with narrow evidence tasks and explicit handoffs, not impressive job titles.
What the research reports
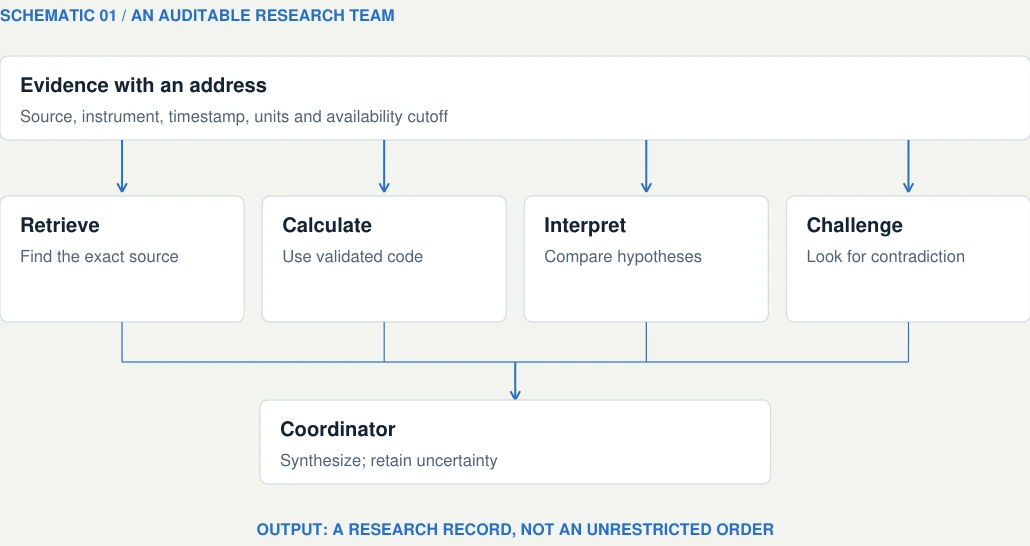
The Expert Investment Teams study decomposes investment analysis into fine-grained tasks and evaluates the framework on Japanese equities under leakage controls. Its reported improvement over coarser designs makes task structure worth investigating; it does not imply that adding more agents always helps. [S6]
The handoff is a contract
In our proposed workflow, an evidence agent must return a source location, observation time and uncertainty flag. A numerical tool returns inputs, units and a reproducible calculation. A coordinator receives both, but cannot convert disagreement into certainty by taking a vote. These are editorial design suggestions, not a description of an existing MarketDeck execution product.
Test the contribution
Remove a specialist and repeat the evaluation with the same data cut, costs and decision horizon. Check whether the role changes evidence quality, latency or decisions. Correlated agents repeating the same source can create the appearance of consensus without adding information.
03 / SELF-EVOLVING POLICIES / PAGE 5
Change the playbook.
Some new agents adapt the procedure around the model rather than retraining the model itself.
EvolveTrade, in plain language
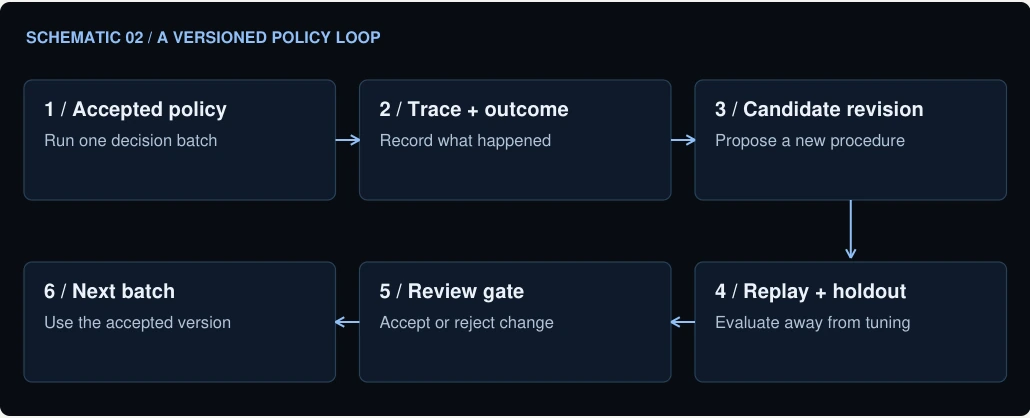
EvolveTrade treats the trading agent's system prompt as an editable policy. At update intervals, a Policy Agent reviews decision traces and realized portfolio feedback, revises the procedure, and supplies it to the next decision batch while the backbone LLM stays fixed. The authors report improvements over fixed policies in many evaluated settings. [S1]
Why the distinction matters
A policy update might change which evidence is checked first, when code is called or how conflicting signals are handled. That differs from changing learned model weights. It also means the operating instructions become a versioned research object. A revised prompt can introduce a failure just as a code change can.
Editorial guardrails for adaptation
Preserve the previous policy and its data cutoff. Evaluate the candidate on untouched data and replay known bad cases. Separate an observed result from the explanation proposed for it. Approve a candidate only after checks; keep a route back to the last accepted version. Do not let a profitable few days automatically rewrite a live system's authority.
04 / THE HYBRID PATTERN / PAGE 6
More voices, better signal?
A specialist-removal test is more informative than assuming every extra agent earns its place.
A measured example
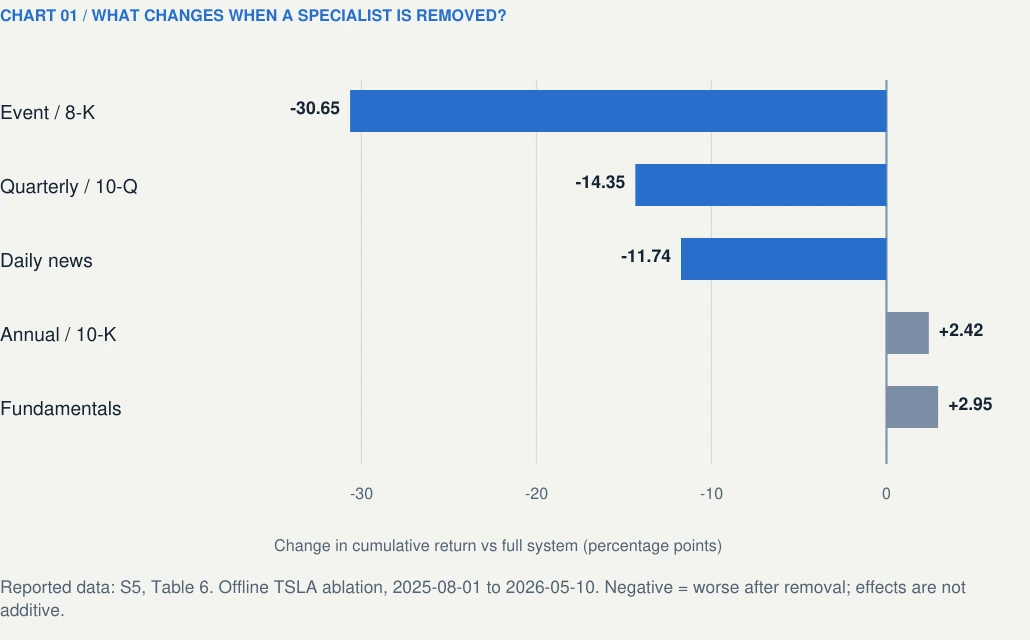
Fin-Analyst combines eight LLM specialists for TSLA with a rule-based BTC path. In its historical TSLA ablation, removing the event, quarterly or news specialist reduced cumulative return; removing two slower inputs slightly increased it. The chart redraws Table 6, not live portfolio performance. [S5]
Read the signs correctly
The zero line is the full system. A negative bar means performance was lower when that role was removed; a positive bar means the reduced system did better in that experiment. These are percentage-point changes, not individual-agent returns, and the effects need not add up.
The right conclusion is narrower
This supports testing each information channel at the intended horizon. It does not show that annual filings are generally unhelpful or that one role guarantees returns. A hybrid stack can assign prose interpretation to models while leaving calculations, position state and hard limits to code.
05 / BENCHMARK REALITY / PAGE 7
Profit is not the full test.
A good result must survive a second question: where did the return come from?
Separate knowledge from skill
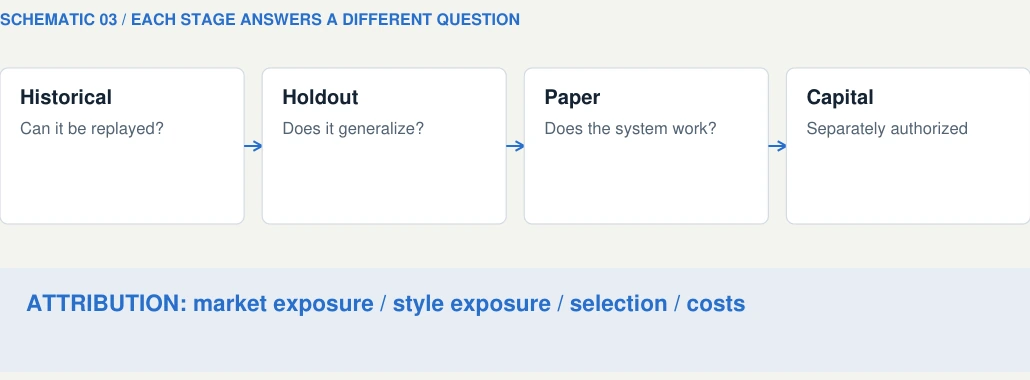
KTD-Fin masks identifying and calendar information across prompts and tools to reduce the use of memorized market history. It also decomposes returns into market, style and stock-selection components. Its authors report limited evidence of persistent selection alpha among ten tested agents on CSI300 data after these controls. [S4]
Why attribution changes the story
Imagine a portfolio rising while the wider market rises. The gain is real, but it does not by itself identify a useful selection rule. Conversely, a defensive process can lag in a rising sample yet still serve a different stated objective. Define the objective before choosing the benchmark; do not select a flattering comparison afterward.
Build an evidence ladder
Start with a frozen historical experiment, then an untouched holdout, a live-price paper run and only then a separately authorized capital test. Record costs, rejected orders, missing inputs and downtime. A change in environment can invalidate the comparison even when the model name has not changed.
Repeatability belongs in the scorecard
Replay identical inputs to examine decision stability. Track whether a conclusion survives nearby assumptions, alternate windows and simple baselines. Report uncertainty and failures beside the headline metric instead of hiding them in a final disclaimer.
06 / PRODUCTION EVIDENCE / PAGE 8
A flat line can reveal a lot.
In one pre-alpha fleet, median chosen leverage stayed fixed even as measured volatility changed.
The reported pattern
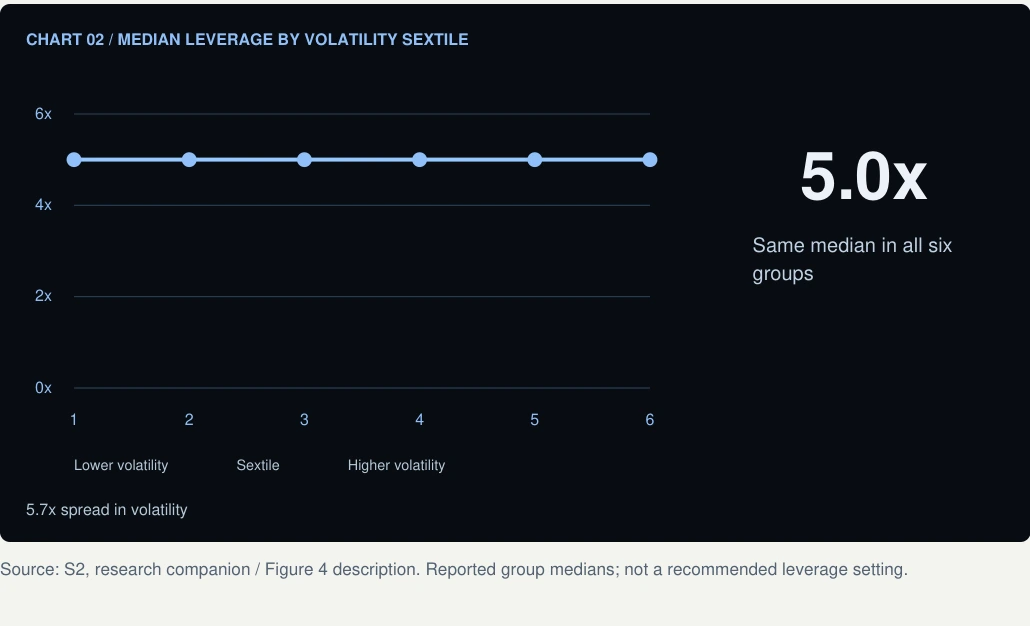
DXRG's research companion reports median leverage of 5.0x in every volatility sextile across a 5.7x volatility spread. It also reports that one posture-and-slider group held 11% of positions but 62% of liquidations. These aggregates describe that system and period, not all trading agents. [S2]
Know which record you are reading
The companion distinguishes 3,505 user-funded Terminal Pro vaults trading real ETH over 21 days from the later DXAP record: 231,638 turns and 14,596 fills over 69 days, largely paper execution at live prices plus a small real-capital book. It is a pre-alpha baseline, not the current product's performance. [S2]
Editorial interpretation
A model can describe volatility without changing its exposure appropriately. Inspect the actual order-sizing rule and where risk inputs enter it. The flat median is a warning about that operating behavior; medians alone do not show every agent's choices or establish the effect of an alternative sizing rule.
07 / EXECUTION AND EXITS / PAGE 9
Reaching upside is not keeping it.
The path through a position can tell a different story from the final profit-and-loss number.
A gap worth investigating
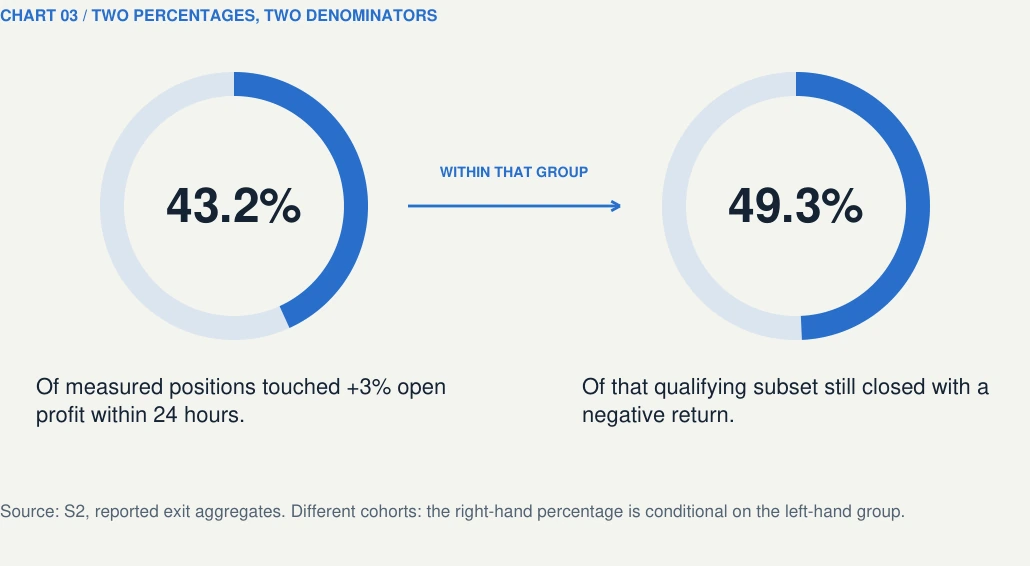
In the DXRG record, 43.2% of positions touched at least +300 basis points of open profit within 24 hours; 49.3% of those positions still closed negative. A basis point is one hundredth of a percentage point, so 300 basis points is 3%. The two percentages use different denominators. [S2]
Do not turn hindsight into an exit rule
A favorable excursion is visible after the path has unfolded. It is not an executable instruction available at the entry time. A rule selected because it fits those paths needs a new evaluation window, realistic fees, liquidity assumptions and reproducible trigger handling.
Measure the whole chain
Separate idea selection, allocation, execution and exit behavior. A bad fill, stale position, duplicate order or late risk response can overwhelm a plausible thesis. Store intended action, accepted order and confirmed fill as different records so a post-mortem can locate the failure.
What a useful replay asks
At each decision point, what was actually known? What action was permitted? What was submitted, acknowledged and filled? A replay should not silently use later data or assume an order succeeded. That is an engineering discipline as much as a forecasting problem.
08 / TRUSTWORTHY AUTONOMY / PAGE 10
Authority needs a boundary.
The final risk check should not be another paragraph asking the model to be careful.
Information can carry an attack
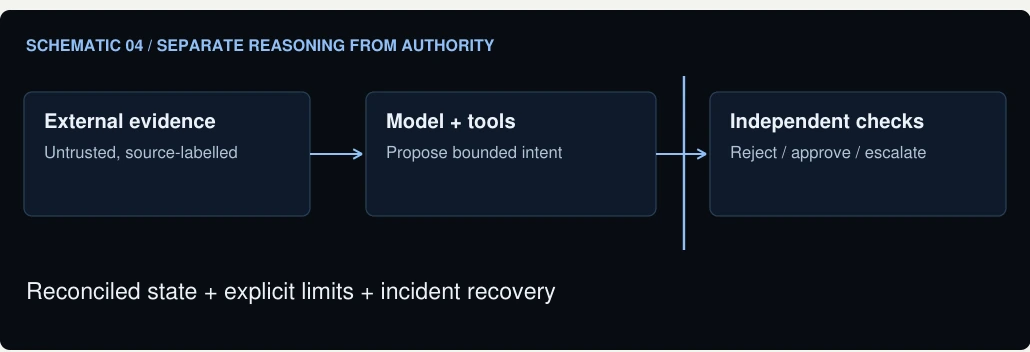
Contagion on the Trading Floor studies adversarial content entering through social-media evidence in an offline multi-agent benchmark. The authors report degraded risk-return metrics and show that some coordinator designs dampen the effect. This is a robustness experiment, not evidence of a specific live breach. [S3]
A useful governance parallel
A September FSI speech argues for both model governance and wider operational resilience as AI changes financial systems. The banking-supervision context differs from a trading agent, but its emphasis on accountability and recovery is a useful parallel. It is not approval of a trading method or India-specific legal advice. [S7]
An editorial control pattern
Treat retrieved content as evidence, never as an instruction source. Keep reconciled state outside model memory. Use independent checks for exposure, stale data, duplicate actions and service health. An explicit human decision can then grant tightly limited authority; an incident path should be able to revoke it.
India-aware research, without pretending to execute
For a MarketDeck research workflow, preserve the exchange, instrument, filing date, currency and observation time. Use the suite to investigate a question and keep execution separate. This magazine neither connects to a broker nor authorizes automated trading. Applicable market-data and execution requirements need their own current review.
FIELDWORK / INTERACTIVE NOTEBOOK / PAGE 11
Turn the reading into a test.
A reusable, fillable worksheet for a research experiment - not an order ticket.
Choose one small question
Write a falsifiable question rather than an ambitious mandate such as beat the market. For example: does a source-checking step reduce unsupported event claims on a fixed set of filings? Define what counts as a failure before running the comparison.
Save your own working copy
The fields below are standard PDF form fields. Many desktop readers can save them; support varies in mobile and browser viewers. Open in a compatible PDF app if editing is unavailable. Nothing in this document sends your entries to MarketDeck. Do not enter credentials, account numbers or personal financial information.
REFERENCE DESK / METHODOLOGY / PAGE 12
Keep the evidence attached.
Primary sources, chart provenance and the limits of this edition.
What changed in this edition
The eight-page outline has been expanded into a visual, source-checked 12-page edition. The original themes are retained. The DXAP evidence is explicitly labelled as mainly paper execution at live prices, and the inconsistent Fin-Analyst live BTC summaries are not used for charting.
How to read the graphics
The ablation bars reproduce five Table 6 values from S5. The leverage and exit graphics redraw aggregate observations from S2. Diagrams of teams, policy review and controls are original MarketDeck schematics, not representations of a deployed trading strategy. We did not reproduce or independently validate the experiments.
Publication and use
Edition 2.0 / sources reviewed 22 September 2026 / MarketDeck editorial synthesis. Links open the original source or its author-maintained companion. Research can change; the review date is not a claim of continuous freshness. This publication is educational, not personal financial advice.
Primary source references
- S1 / EvolveTrade: Experience-Driven Policy Refinement for Self-Evolving LLM Trading Agents
Source date: 15 September 2026. Reviewed 2026-09-22.
- S2 / What LLM Trading Agents Actually Do in Production
Source date: 4 September 2026; research companion reviewed 22 September. Reviewed 2026-09-22.
- S3 / Contagion on the Trading Floor: How Adversarial Signals Spread in Multi-Agent Trading Systems
Source date: 17 September 2026. Reviewed 2026-09-22.
- S4 / From Knowing to Doing: A Memory-Controlled Benchmark for LLM Trading Agents on Stock Markets
Source date: 27 May 2026. Reviewed 2026-09-22.
- S5 / Fin-Analyst at FinMMEval 2026 Task 3: A Live Hybrid Trading Agent with LLM Specialists and Rule-Based Signals
Source date: 14 July 2026. Reviewed 2026-09-22.
- S6 / Toward Expert Investment Teams: A Multi-Agent LLM System with Fine-Grained Trading Tasks
Source date: 26 February 2026. Reviewed 2026-09-22.
- S7 / Supervising banks in an AI-shaped economy
Source date: 18 September 2026. Reviewed 2026-09-22.